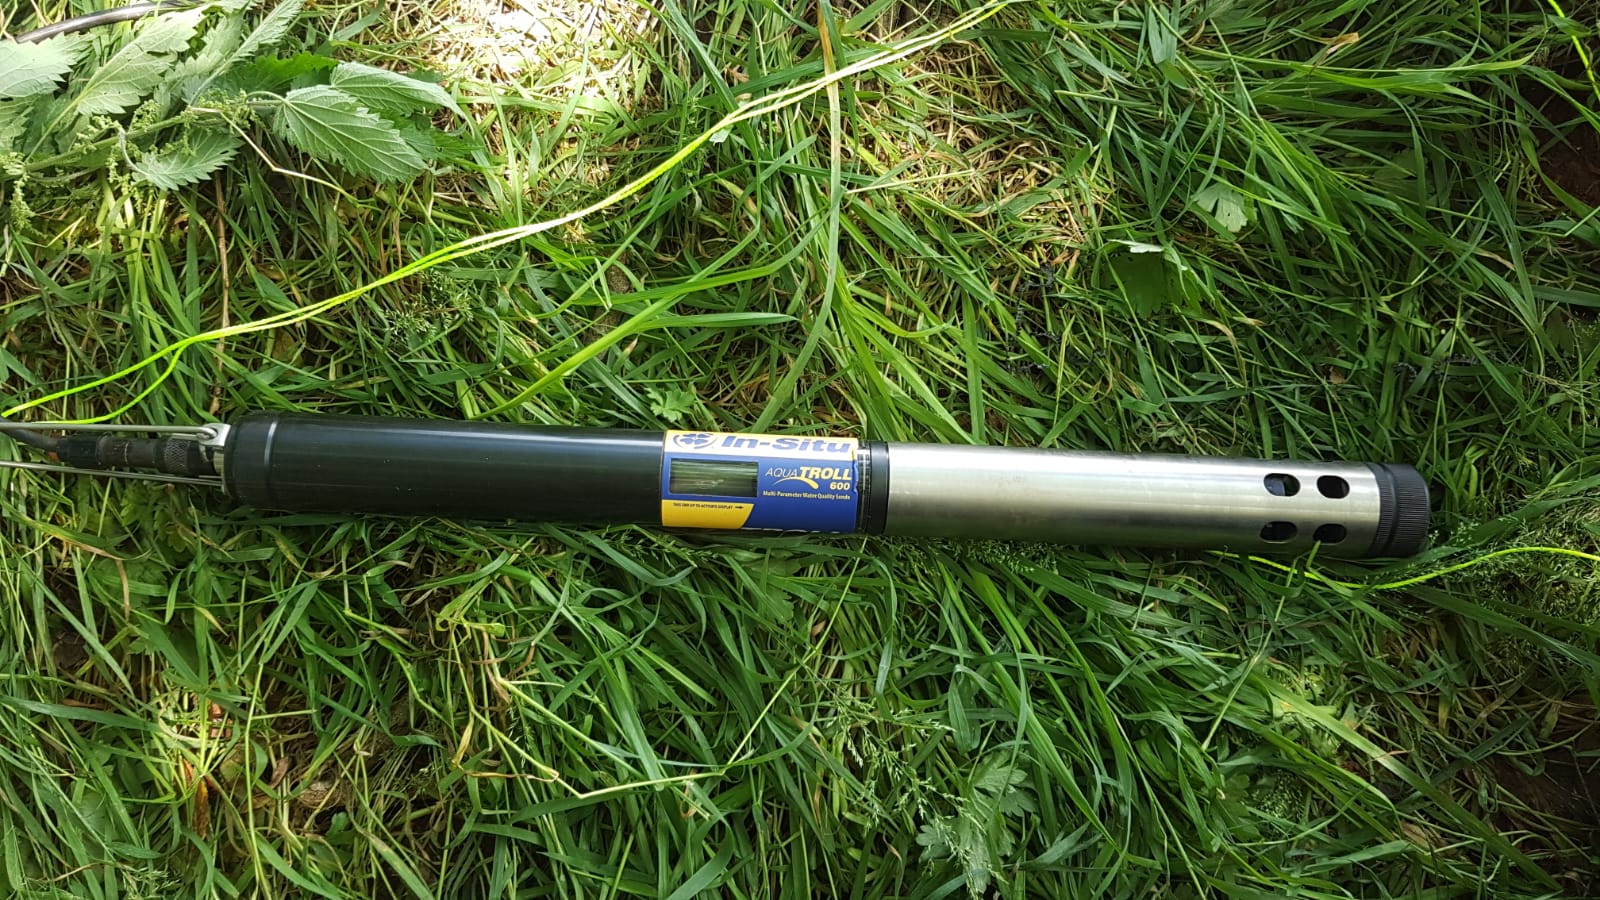
During July a mysterious piece of equipment was installed on the River Culm’s main channel: the Culm sonde. But what’s a ‘sonde’ you may ask and why does the Culm need one?
A sonde is “an instrument probe that automatically transmits information about its surroundings from an inaccessible location, such as underground or underwater” (loads more Wiktionary meanings here). In the case of the Culm, that location is underwater and the information it transmits is about the water quality in the river.


Whether the water quality is good or poor can impact the wildlife and vegetation in the river, as well as the potential of the water for use as a water resource for people. The sonde will help the CtC project monitor a range of parameters to determine how good or poor it is and the likely effects. A ‘baseline’ of data is being collected before any Nature-Based Solutions are installed nearby and then data will be collected after installation to identify if the NBS are helping to improve water quality. Sense-checking of the data has been happening over the last few months to identify the causes of a few noticeable events.
The sonde was installed under the watchful eyes of some nearby cows on 20th July in the midst of a heatwave with air temperatures approaching 30 degrees C: temperatures in the river reached well over 21 degrees C for several hours each day, for four days in a row. At WRT we don’t carry out electrofishing when the temperature is above 18 degrees C as fish are already stressed at these temperatures so this was set as the first data alarm on the Culm sonde – meaning we get a notification if temperatures rise above the alarm level. A second alarm threshold was set on the sonde for ‘very high’ temperatures exceeding 21 degrees. Around the same time shocking footage emerged of salmon suffocating in the Columbia River in the USA the temperatures in the Culm (22.5 degrees C on July 22nd ) were even higher than those seen in the Columbia River (70 degrees F or 21 degrees C).
As water warms it is able to hold less oxygen, also microbial activity – consuming oxygen – increases. So at the same time that fish would have been stressed due to high temperatures, they were also seeing oxygen levels drop to below 6 mg/l. Salmon and trout are most affected by low oxygen levels; they will attempt to avoid areas where dissolved oxygen is less than 5 mg/l. The lowest level recorded in the R. Culm during this period was 4.3 mg/l – thankfully that was just for a very short time.
The yellow dashed lines on the graphs below are the ‘alarm’ levels and the wavy yellow line is the data recorded by the sonde – you can see the striking difference between the two in some places!

Over the period 27th September to 6th October we saw several heavy rainfall events – the depth of the river increased rapidly to 1.6m above the sonde, until then we had seen a maximum of 40 cm of water. Accompanying each hydrograph peak was a dramatic rise in turbidity as soil from exposed farmland was washed into the river. Turbidity values were recorded in excess of 400 NTU (nephelometric turbidity units). Whilst these units don’t directly correspond to the turbidity values measured by our CSI volunteers, we can assume they are in the same ‘ballpark’ and we know what it takes to register >240 – the maximum we can record with the turbidity tubes! Interestingly turbidity peaks for the first and second rainfall events were similar – but much higher than for the second event – despite flows in the river being similar.

Our aim is to bring you a ‘live’ feed of the data once a few more technical things are in place and some people have trialed it for user-friendliness, so communities around the Culm can see and explore the data themselves.


Leave A Comment